





Ing. Lubomír Zeman: Melt flow index and its use in thermoplastic injection moulding technology - theory and practice part 1

Introduction
Plastics injection moulding technology is a thermodynamic, cyclic forming process. It is one of the most widely used technologies for processing thermoplastics, thermoplastic elastomers, polymer blends, composites, as well as thermosets, elastomers (rubbers) and vulcanised rubbers. In this article, I will address the subject of the melt flow index as it relates to the injection moulding of thermoplastics, thermoplastic elastomers, thermoplastic polymer blends and composites with a thermoplastic matrix.
When injection moulding thermoplastics, in each continuously repeated operating cycle, it is always necessary to prepare a polymer melt with the greatest possible temperature homogeneity from the relevant granules, which have been pre-compounded by the manufacturer (fillers,colourants,flame retardants, compatibilisers, additives modifying processing, physical, thermal and mechanical properties, resistance to degradation and ageing, resistance to weathering, resistance to biological agents, etc.), including any modifications made to the supplied granules by the manufacturer of the moulded parts before the actual injection moulding process (drying below the specified residual moisture content, adding a blowing agent, mixing with a colour masterbatch, adding recycled material, etc.). Using injection pressure and injection speed, this melt is conveyed through the injection mould's runner system into the temperature-controlled or cooled mould cavity as gently as possible, i.e. without significant shear stress.
In the mould cavity, the holding pressure phase of the injection moulding process (pressure applied for a specified period) is used in an attempt to eliminate thermal volumetric contraction – moulding shrinkage – so that, after cooling and ejection from the mould cavity, the moulded part has the specified shape and dimensions, as well as the other required quality parameters.
Rheology
The preceding paragraph introduces the concept of a melt and its conveyance into the mould cavity, i.e. we are discussing the flow of a polymer melt. Any forming process, including injection moulding, is possible only when flow occurs within the material. Flow is studied by the science known as rheology.
Rheology is a scientific branch of continuum mechanics (continuum mechanics is the part of mechanics concerned with the motion of gases, liquids and deformable solids, as well as force interactions, the mutual action of two or more agents in such bodies), devoted to investigating and modelling the deformation properties of substances, particularly the relationship between deformation, stress and time. Rheology is thus the science concerned with deformation and flow. The name rheology originates from Greek, where rheos means river, flow or flowing. Rheology therefore literally translates as the science of flow.
When fluids flow, shear stress acts on them and the system performs work. The work done by shear stress is converted into heat, and we call this process internal friction (dissipation of mechanical energy – dissipation, from the Latin dissipatio = dispersal, denotes the irreversible conversion of one form of energy into another). Viscosity is a material property that indicates the resistance to the relative motion of individual fluid particles, or how readily a fluid yields to stress. The higher the viscosity, the greater the fluid's resistance to motion.
However, rheology is not limited to the flow behaviour of liquids but, as mentioned above, also concerns the deformation of solids, which likewise flow under certain circumstances (over time). “Panta rhei!” - Everything flows! - Hérakleitos z Efesu (approx. 540 to 480 BC).
The fundamental quantity in rheology that characterises flow behaviour is viscosity, which determines the degree of internal resistance of materials to external loading, in other words, resistance to flow. Maintaining melt flow requires a driving force, the magnitude of which depends on the size of the macromolecules, the molecular weight and the magnitude of the intermolecular forces in the given thermoplastic polymer material.
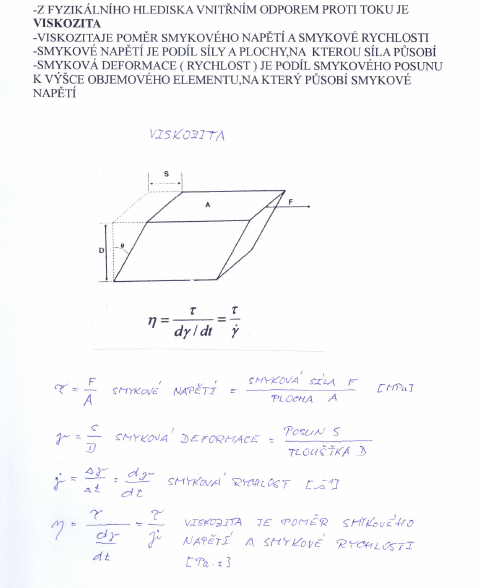
Viscosity is given by the ratio, or quotient, of shear stress to shear rate, where shear stress is the force divided by the area over which it acts. Shear deformation, or shear rate, is the ratio of shear displacement to the height of the volume element on which the shear stress acts. This is illustrated in Figure 1:
 |
|
| Fig. 1 : Definition of viscosity |
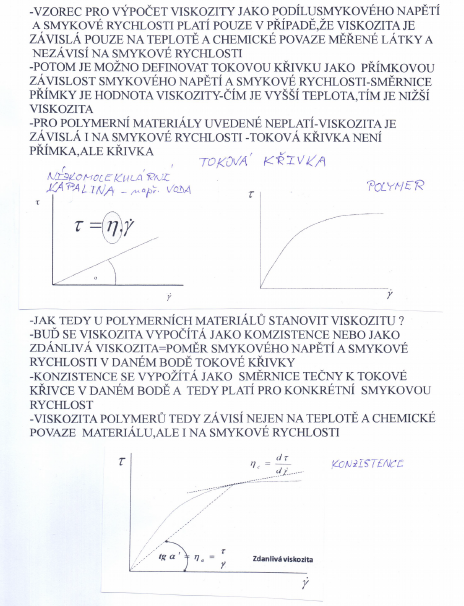
The formula for calculating viscosity as the ratio of shear stress to shear rate applies only when viscosity depends solely on the temperature and chemical nature of the substance being measured and does not depend on shear rate. In such a case, the flow curve can be defined as a linear relationship between shear stress and shear rate, with the slope of the particular line representing the viscosity value, and direct proportionality applies – the higher the temperature, the lower the viscosity value.
The stated direct proportionality does not apply to polymer materials because their viscosity also depends on the shear rate – the flow curve is not a straight line but an exponential curve. For polymer materials, viscosity is calculated as consistency, cohesion or apparent viscosity, which is the ratio of shear stress to shear rate at a given point on the flow curve. Consistency is determined as the slope of the tangent to the flow curve at a given point and is therefore valid only for a specific shear rate – this is explained in Figure 2:
 |
|
| Fig. No. 2 : Flow curves and viscosity calculation |
Rheology studies the flow and deformation of matter and, in simple terms, this science can be described as examining the relationships between deformation and the stress response of the material under investigation. Deformation can be either shear or extensional (tensile). The stress responses of the material under investigation can be either directly or inversely proportional to the induced deformation through a quantity called viscosity (shear or extensional), which determines the material's resistance to shear or tensile deformation. It is determined using special instruments known as rheometers. The basic types of rheometers include rotational and capillary rheometers.
 |
|
Following this basic description of the concept of rheology, we can answer the question – what is the significance of rheology for thermoplastic injection moulding technology? The answer is essentially simple – to set the processing parameters of the injection moulding process correctly, it is necessary to know how much resistance to deformation the specific material being processed has.
The most commonly measured rheological quantity for polymer melts is shear viscosity as a function of flow intensity, or shear deformation rate, which must be measured over a wider temperature range to obtain information about its temperature dependence as well, which is crucial when processing polymer melts. In the case of polymer blends (two or more polymers), compounds (a mixture of a polymer and additives), or composites (a polymer matrix with a filler), it is necessary, in addition to the temperature dependence of viscosity, to determine how viscosity depends on the concentration of the individual components in the resulting material.
Polymer rheology monitors the behaviour of a polymer melt during processing and quantifies (quantification = determining quantity) the material's response to flow.
Rheology examines the relationships between deformation and the stress response of liquids. In general, the stress response can be either directly proportional to deformation (Newtonian liquids, where the proportionality constant is Newtonian viscosity) or inversely proportional (non-Newtonian liquids, where viscosity is a function of deformation rate,or time).
It must be emphasised that for non-Newtonian liquids the concept of viscosity as a material constant has no physical meaning and must be replaced by a flow curve over the required range of shear stresses. Given the possibility of various anomalies, values obtained by extrapolation cannot be relied upon. An apparent viscosity value measured using a simple viscometer without specifying the shear stress or velocity gradient can serve only as an indicative comparison of the consistency,cohesion of non-Newtonian liquids of the same type measured using the same instruments and under the same conditions.
Non-Newtonian Liquid
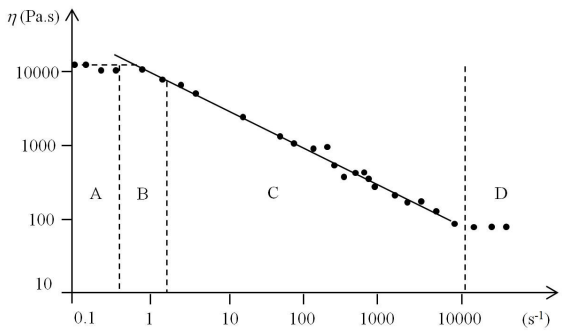
Most polymer substances exhibit Newtonian behaviour during flow only at very low shear deformation rates – region A, the so-called first Newtonian plateau in Figure 3, “Typical flow curve for polymer melts”. As the shear deformation rate increases, viscosity ceases to be independent of this variable. It either decreases, which is typical behaviour for polymer melts, or increases. In the so-called transition region (region B), the slope of the relationship changes, but gradually stabilises at a constant value that determines the degree of non-Newtonian behaviour (region C). The description of the flow curve concludes with the final region (region D), the so-called second Newtonian plateau, which is characterised by viscosity once again stabilising independently of the continuously increasing shear deformation rate (such high shear deformation rates are very difficult to measure).
 |
|
| Fig. No. 3 : Typical flow curve for polymer melts |
 |
|
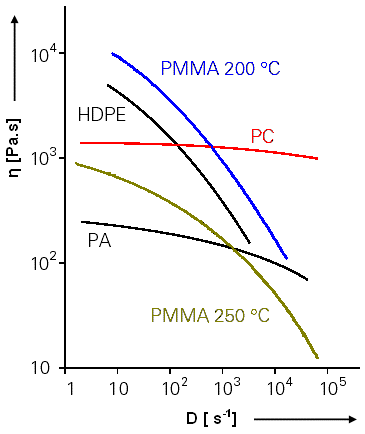
| Fig. No. 4 : Viscosity versus shear rate curves for selected thermoplastics |
|
Figures 3 and 4 clearly show that as the rate of shear deformation, or shear rate, increases, the viscosity of the given polymer material decreases. In terms of the molecular structure of thermoplastics under shear stress, this decrease can be explained as follows: polymer melts have an amorphous structure, and the macromolecules assume a shape corresponding to the maximum entropy of the system – a loosely coiled ball (entropy – in layman's terms = a measure of the uncertainty of a random process).
At low shear rates, in region A – Fig. No. 3 - referred to as the region of maximum Newtonian viscosity (approximately from 10 E-1 to 10 E0s-1), the viscosity can be considered constant and equal to the maximum Newtonian viscosity, because the macromolecules move as a whole. At higher shear rates (in the region of structural viscosity), the viscosity decreases, and its value depends on the instantaneous values of shear stress and shear rate; it is therefore referred to as apparent viscosity.
The decrease in viscosity can be explained by the uncoiling of the macromolecular coils due to the action of shear forces in the direction of flow. These more or less extended macromolecules move more easily, which is reflected in a decrease in viscosity. At extremely high shear rates (region D – Fig. No. 3), the viscosity once again becomes independent of the shear rate. This corresponds to a situation in which the macromolecules would become fully uncoiled. However, this stage cannot be reached in polymer melts in industrial practice.
One of the tasks of rheology is to mathematically describe the complete relationship shown in the figure above. Clearly, region A is well described by Newton's law of viscosity:
Newton's law of viscosity defines the relationship between stress and the rate of deformation as direct proportionality, where the constant of proportionality is dynamic viscosity, i.e.

where 


Region C is most commonly characterised by the so-called power law, where the shear stress is determined by the formula: where K is the consistency index (Pa.sn) expressing the fluidity of the material (a high K value means high viscosity, low fluidity), the fraction is the velocity gradient along the axis perpendicular to the shear plane of the fluid layers (s-1), n is the non-Newtonian behaviour index (n>1 dilatant; nn=1 Newtonian).
A major advantage of the power law is its simplicity. It is a two-parameter model, with both parameters determined from experimental data. The use of the power law is limited by the fact that it agrees with experiment only within a certain range of shear deformation rates (region C). At low shear deformation rates, it predicts infinitely high viscosity. It does not describe the transition region (region B) or the so-called second Newtonian plateau (region D).
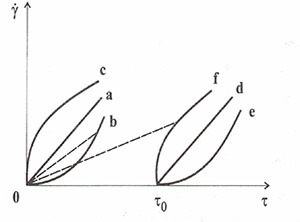
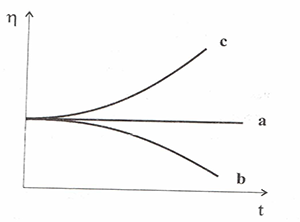
Non-Newtonian liquids can be further classified according to how their stress response depends on deformation over time. If the deformation is independent of time, the liquids may be pseudoplastic or dilatant; if the response is time-dependent, the liquids may be thixotropic or rheopectic – see Figures 5 and 6.
 |
|
| Fig. No. 5: Flow curves for various types of model liquids:(a) Newtonian liquid, (b) pseudoplastic liquid, (c) dilatant liquid; (d) Bingham liquid (a liquid with a plastic component of deformation, in which flow occurs only after a certain threshold shear stress, i.e. the yield stress, is exceeded), (e) pseudoplastic liquid with a yield stress, (f) dilatant liquid with a yield stress – tau zero = threshold shear stress (yield stress) at which permanent (plastic) deformation begins to occur |
|
 |
|
| Fig. No. 6 : Viscosity versus time: (a) Newtonian liquid, (b) thixotropic liquid, (c) rheopectic liquid |
Pseudoplastic liquids are characterised by a decrease in shear viscosity with increasing shear deformation rate. Pseudoplastic fluids primarily include polymer melts and polymer solutions, but also, for example, yoghurt, ketchup or blood. From a processing perspective, pseudoplasticity is a desirable property because it reduces the energy required for liquids to flow through pipes or for mixing liquids.
The opposite phenomenon to pseudoplasticity is dilatant behaviour, characterised by an increase in viscosity with increasing shear deformation rate. This primarily includes suspensions (a solid in a liquid phase), for example corn starch dissolved in water.
Thixotropic liquids - shear viscosity may depend not only on the shear deformation rate, but also on time. If the viscosity of a given liquid decreases over time under constant stress ( for example during mixing ), it is a so-called thixotropic liquid. Once the mechanical stress ceases, the original structure of the liquid is restored and the viscosity returns to its original value.
The opposite of thixotropic liquids are rheopectic liquids, which are characterised by an increase in viscosity over time under constant stress. Typical rheopectic liquids include, for example, lubricants, plaster, concrete or inks.
End of Part One. Continued on 6 December 2024
-

Jiří Češka, Nástrojárna Příbram
Production of injection molds, cutting and stamping tools, CNC machining, electric discharge machining, laser welding.

Suppliers on this topic
-

Plasted spol.s r.o.
Plastic processing, production of plastic products, production of plastic windows, plastic window profiles, plastic… -

KOH-I-NOOR MACHINERY a.s.
Development and production of tools, injection molds, blow molds, plastic injection, blow molding machines for… -

Mateja Plasty, s.r.o.
Processing of thermoplastics and thermosetting plastics using injection molding, extrusion and blow molding. -

Elektroplast výrobné družstvo Prešov
Production of plastic products, injection, vacuuming of plastics, plastic technical moldings, household goods. -

Extruindustrie CR s.r.o.
Extrusion of plastics, production of plastic profiles, plastic profiles, boards, rods and others, plastic and rubber… -

JASPLASTIK-SK spol. s r.o.
Plastic components for the automotive, electronic and industrial markets, plastic molding, assembly, painting, PVD…



ALLROUNDER e TREND: ARBURG Sets a new standard in electric injection moulding machines
21.9.2026 Rising energy costs, pressure to improve production efficiency and a shortage of skilled workers are changing how plastics processors assess new investments. ARBURG is responding to these trends with the launch of its new ALLROUNDER e TREND series...



Most read in the last 7 days
-
Polymer prices - october price increases partly successful, with minor corrections expected in the week ahead
-
Polymer prices - Year-End Polymer Price Scenarios
-
Long-lasting solution: Radiation-crosslinked PE-Xc pipes for drinking water supply
-
Polymer prices – the increase in olefin monomer contract prices in October was in line with expectations
-
Plastica-expo 26





Most read in the last 7 days
-
Polymer prices - october price increases partly successful, with minor corrections expected in the week ahead
-
Polymer prices - Year-End Polymer Price Scenarios
-
Long-lasting solution: Radiation-crosslinked PE-Xc pipes for drinking water supply
-
Polymer prices – the increase in olefin monomer contract prices in October was in line with expectations
-
Plastica-expo 26